
I‘m not a data scientist and I barely understand the basics of Python or R. I heard Open Data is a good thing but I know nuts about wrangling public datasets on our Open Data portal.
However, I do know for a fact that everyone’s talking about Open Data, Data Science and its possibilities. I also heard we should avoid the term “Big Data”.
But you know, everyone’s talking about it and you often see people peppering their speech with “Big Data” this and that, just to impress others. 😏
I get the hype, I get the theoretical benefits and I get that it can even save lives.
As a Singaporean woman in her mid-20s who fears tech jargon, I honestly don’t care much about writing the right script to analyse the data. Not just because I can’t, but here’s what I care more about.
Show insights that make an impact
Data is meaningless to me if it does not provide me with useful interpretations that’ll allow me to make better decisions systematically and efficiently. Putting data in neat tables is one thing; being able to empower millions of citizens to make better decisions through insights derived from data is one that I care about more.
What is in it for me?
I want to know if my estate has been identified as a Zika hotspot vis-a-vis other estates and how many cases has been confirmed in real time.
I want to know where property prices are the highest and lowest, so I have an idea of where to start looking for a resale flat. One of my colleagues created this property hotspot chart for people like me.
I want to know where I can find a taxi, and where the nearest taxi stand. You can check all that information with this TaxiRouter map.
Lastly, I dislike going to the gym when it’s packed. This ActiveSG gym tracker allows me to schedule my time wisely so I can exercise in comfort.
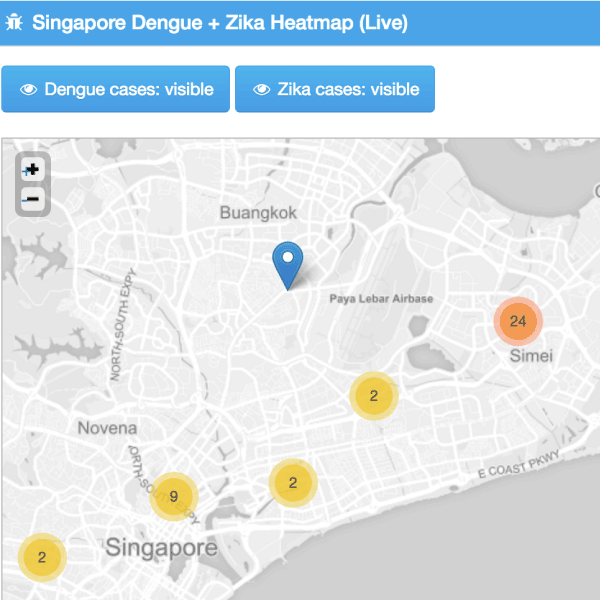
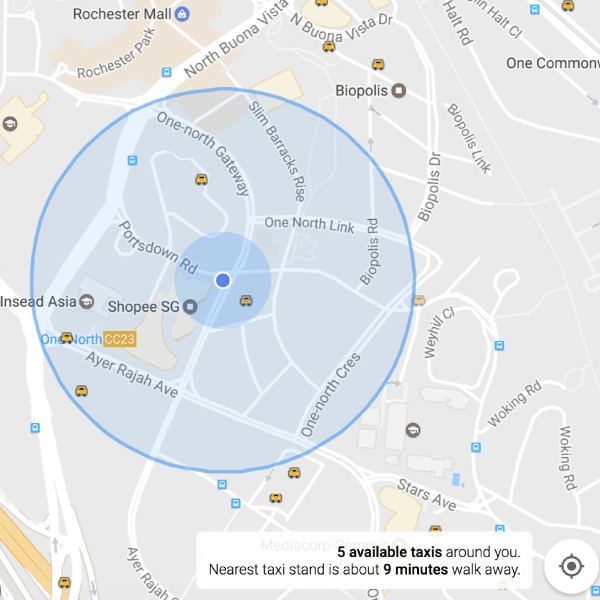
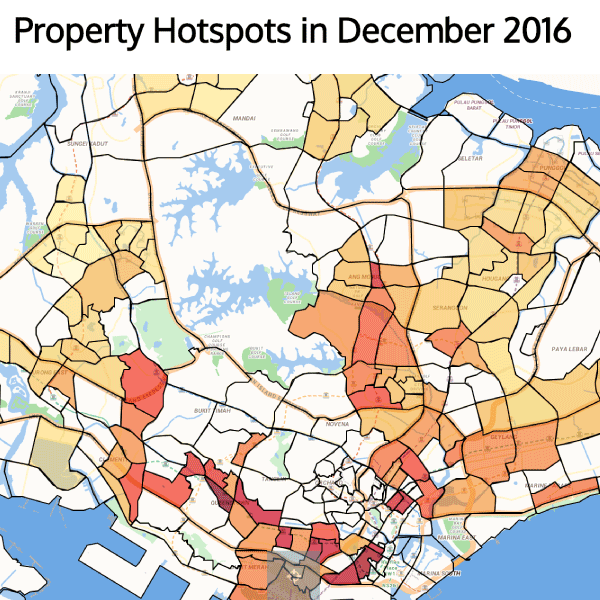
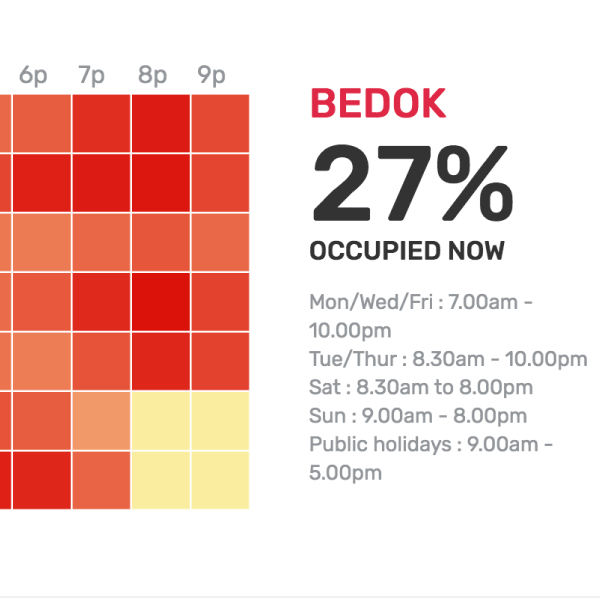
Some apps created from open data. Sources: http://viz.sg/viz/dengue/, https://hdbresale.daburu.xyz/, https://taxirouter.sg/ and http://gym-tracker.data.gov.sg/)
Tell me what the data says without confusing me
Data is meaningless if it does not convey an understandable message for the critical mass.
Singapore’s MRT Circle Line got disrupted frequently last year and affected many fellow Singaporeans like me. When it finally got resolved, we wanted to know why and how it was resolved.
The GovTech data scientists involved in the Circle Line incident went on to pen a story about the rogue train in a manner that even a tech noob like me could comprehend and appreciate. 🤔
A good data story should show us the interpretation of data, challenge assumptions, let readers play with data, and use creative expressions. Here’s a personal favourite.
This article was first published here.

Absolutely agree with what you said. Unfortunately, we don’t have good data visualization platform here in Bangladesh much. Good read!